At around 3pm on Saturday 13th August Kevin Pieterson took the catch off the bowling of Tim Bresnan and India were all out losing the 3rd test of the 4 match series. The outcome of this means that regardless of the result of the final test that starts on thursday at the Oval, England will be crowned the Number 1 test team in the world.
The rise has been remarkable. I remember stood by the pavilion in 1999 when England were officially the worst team in the world having lost the test series 2-1 to New Zealand at Home. Something had to change.
But the question that is bugging me is, how good is this England team? I think the stats can prove this, because simple measures such as winning percentage, batting and bowling averages have always been measured and cricinfo has a massive archive of this sort of thing.
However, the first thing to consider is how much cricket is being played today. It will come as no surprise to discover that we are playing nearly double the amount of tests now compared with 50 years ago. This is not only because of the number of teams, but also because of air travel. In the 1950’s England had 1 winter tour and you got there by boat. Today there are 2 or 3 to different countries.
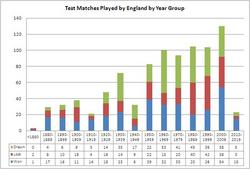
We can still look at how many matches have been won, lost and drawn.
In addition, I am going to focus on the period from 1990/1991 to 2011 as this is 20 years of English cricket and highlights the lows and highs of their performance.
You can probably see from the charts that the number of tests in the last 20 years has stayed roughly constant while in the past it was less. Note the dips for the decade for the first and second world wars when less cricket was played.
In addition, the breakdown shows us in the blue bars where England have done well in a season. Note the winter tours are split from the summer season allowing us to see home vs away.
While looking at the blue bars shows us how few matches England won in the bad days of the 1990s, it is still absolute numbers and better represented as a Winning percentage
First we need to look at this over time
And then focus on 1990 – 2011
We can clearly see the decades and seasons that were weak.
I’ve used a 3 point moving average for the grouped years and a 5 point moving average for the last 20 years in all cases to give a sense of how performance is changing.
You can see the climb following the dreadful winter of 2008/09 where they lost in India and The West Indies
This is followed by a steady rise as the Flower/Strauss regime kicked in. This had the win at home for the ashes in 2009, a successful winter tour, another win at home in 2010, the first ashes away win since 1987 in 2010/11 and series wins against sri lanka and india in 2011.
The next thing I want to consider is batting average across all positions:
This shows that batting average has followed winning percentage over the decades.
We can focus in on the same 20 years:
Again we see the 2006/07 the thrashing england took from australia is highlighted by the dip along with a low average in the 1990’s.
Less telling, but worth noting is the highest score a side has achieved in a season, along with the lowest total in the same time period:
Focusing in on the recent times probably more interesting is the low scores where we see when england have been skittled out:
Of course we can’t look at a side’s performance without thinking of the bowlers, so we need to consider bowling averages
Again we see the bowling averages mirroring the win percentage, but it is a little more complex as you can draw matches without having a good bowling performance. It also suggests that while England’s winning is as good as it was in the 50’s the bowling of Tyson, Statham, Bedsor, Laker and Lock was something special. That said, the batting then wasn’t bad either with Len Hutton, Dennis Compton, Bill Edrich, Peter May, Colin Cowdrey.
However looking at the most recent years we see that England’s bowling has come on most in the last 3 years:
And again we need to see how many runs the team concedes when bowling:
It is a little misleading when looking at the current decade as the season isn’t complete and also it is only 2 years into the decade.
Zooming in we see the seasons where the wins are partly to do with a good low bowling average
This shows the current england team is doing well against it’s opposition in the same way that the great england teams have done in the past. What it doesn’t show is whether they are better than them or not as that relies on considering the opposition. When I look at the bowling rankings I don’t see the same quality as I did 10 years ago when Warne, McGrath, Pollock, Murali, Kumble, Harbhajan were in their pomp. Still, we have Dale Steyn, Graham Swann, Morne Morkel, Daniel Vettori but there are not enough members in the 300 club in the top of the rankings. So the issue will always be are england number 1 because australia are going through a lull, india don’t tour well, and nobody else is there to challenge them. Perhaps next summer will provide the best challenge when south africa arrive in england searching for that number 1 ranking.


